

After successfully getting a Zabbix server working on Raspberry Pi, I was looking for something that could aggregate logs. Zabbix had a great UI, but i wanted something where I could search through my logs, as well as monitor resources and do specific alerts. My goal is to mostly use it for collecting hardware data, CPU, memory, network, and disk metrics – but also to do some very basic intrusion detection. Graylog seems to do all this and have a better approach to searching through the data.
So – if you’re looking to set up Greylog on a Raspberry Pi 4 (8GB), this is what I did. Just a note, I tried to install Graylog without Docker, and ran into a few issues very late in the install process – there are two binaries (one for Graylog, one for ElasticStack) that are not compatible on the Pi. This install will be using Docker – it’s currently not possible to do it without.
After browsing the internet for a while, I came across a Reddit thread by someone who works at Graylog – this install process is largely based on this thread and the docker page on Greylog’s Website. I also used a few other specific resources like Docker documentation and a ComputingForGeeks blog post for additional help.
1. Build the OS
First – get a micro SD (I used 128GB) and flash your favorite version of Ubuntu – I used the ARM64 image, but Ubuntu server would work fine. Having the desktop version came in handy later on in testing, but it’s possible to do it headless.
ElasticSearch (which is the core component of both ELK stack and Graylog) ships with arm-64bit images (both native OS and docker), which essentially restricts you to a 64 bit OS.
2. OS Setup
This will be slightly different for whatever OS you use, but in general, select a language, select a keyboard type, connect to Wi-Fi, and add a username and password. Then do a quick ‘sudo apt update’ and ‘sudo apt upgrade’ and we’re on our way.
3. Docker
Next step is getting docker installed. I followed this guide. Before you install Docker Engine for the first time on a new host machine, you need to set up the Docker repository. Afterward, you can install and update Docker from the repository. The linked guide can walk you through the all steps to accomplish this correctly.
Once you think you’ve done it, run ‘sudo docker run hello-world’. If Docker is correctly installed, it will greet you with a hearty hello!
Quick two commands, and Docker is done. By adding a user, then you will not have to sudo every docker command. The commands are:
sudo adduser yournamehere docker
sudo reboot
4. Off to the Container Store!
We will need to run three containers: one each for MongoDB, Elastic Search, and Graylog.
I want to run the containers together, so I have to configure a yaml file using Docker Compose – this should have been installed previously, but if it is not, there is a guide to installation here. I also had to run ‘sudo apt install docker-compose’ before this would start working.
Then I made a yaml file. On this page, I used example version 3. I made a file called ‘docker-compose.yml’ and saved that to my home directory. Docker-Compose looks for a file of that name in whatever directory it is run, so it’s best to stick with ‘docker-compose.yml’. You can open it with ‘sudo nano docker-compose.yml’ and then edit in nano.
The yaml file I created is in section 10 below. To create the line GRAYLOG_ROOT_PASSWORD_SHA2, I used this command:
echo -n “Enter Password: ” && head -1 < /dev/stdin | tr -d ‘n’ | sha256sum | cut -d ” ” -f1
In that same directory, I then ran ‘docker-compose up -d’. This command will read through the yaml file and tell docker which images to install (as well as any other specified settings) – in this case, it’s the three images we want! The ‘-d’ makes it run in the background.
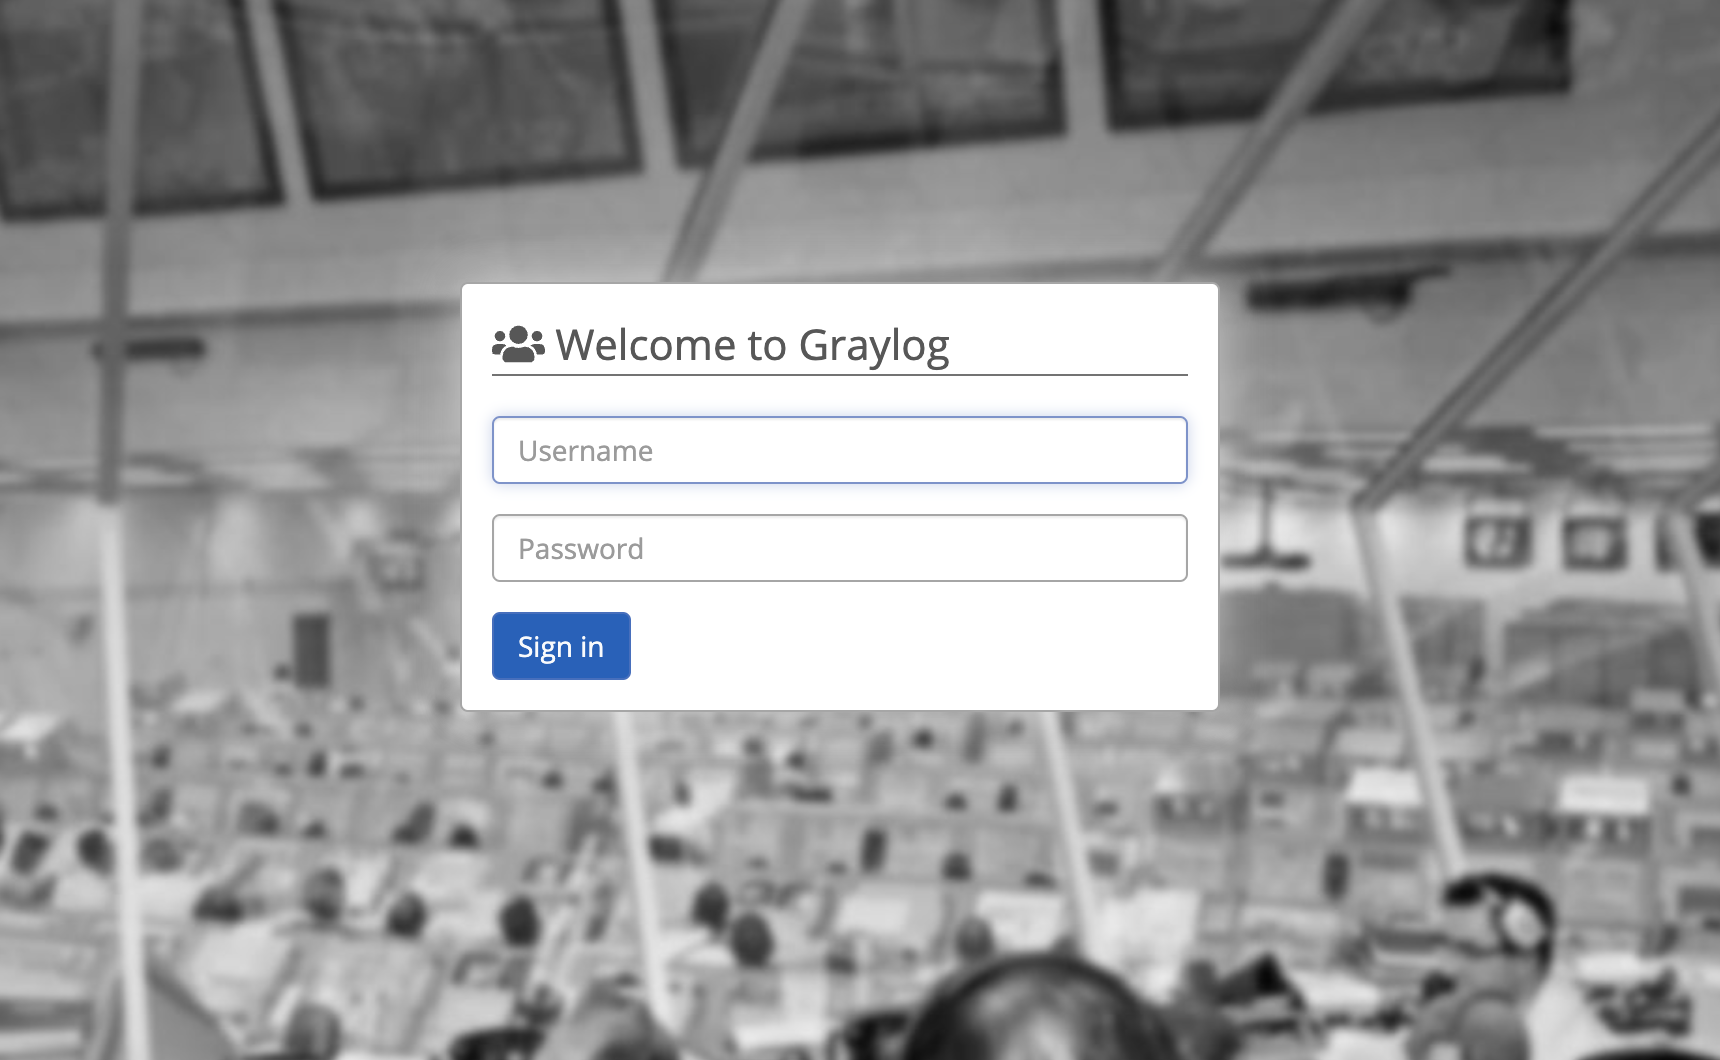
Once that’s done installing, you can either go to 127.0.0.1:9000 on the same machine, or go to the [ip address of the Pi]:9000 from another machine on your network. This will bring up the Welcome to Graylog screen.
5. Starting on Boot
At this point I ran into a little issue. After rebooting, the docker containers didn’t start – First I ran ‘docker ps -q’ – this gave the container id. Then I had to run ‘docker start <container_id>’ for all three services. That’s the manual way – the dumb way. Instead, just run ‘docker-compose up -d’ again, and it will bring up everything. Compose preserves all volumes used by your services; when docker compose up runs, if it finds any containers from previous runs, it copies the volumes from the old container to the new container. This process ensures that any data you’ve created in volumes isn’t lost.
But – the issue remains – after a reboot, the container won’t run. A simple way to do this is add a line in the yaml file. See the red box in the image below:

First, I ran ‘sudo docker-compose down’, updated the yaml file to include the line ‘restart: unless-stopped’, then just run the docker-compose up command again. This worked great. When working in yaml files though, the spacing/tabbing is quite persnickety; the ‘restart’ needs to be in line with the ‘networks’ text using tabs. It’s similar to Python or most other programming languages; the yaml file is basically a configuration file that is set up in a way that a computer can read it.
6. Pump Up the Volume: Persistence
The last piece of the docker puzzle is adding a volume. I mentioned persisting data, however without any volumes, Docker doesn’t know where to put any of it. In order to persist the data, you will use external volumes to store the data. The volumes will be mapped in the yaml file – one each (3 total) for MongoDB, Elasticsearch, and Graylog.
You need to declare the volume in each of the different containers and then declare them globally. Note there is no indent:
mongo_data:
driver: local
es_data:
driver: local
graylog_data:
driver: local
– mongodb:mongo
– elasticsearch
Also in the Graylog container settings, create dependencies as well as linking the volume:
– mongo
– elasticsearch
volumes:
– graylog_data:/usr/share/graylog/data
Then, set the right permissions:
OK – yea, some of you will probably get on me for this not being secure – and you’re right. I know it’s a problem, but this is just for testing, and we can change it once we know everything is working properly. If any of you have suggestions for the best way to better secure it, please leave a comment!
7. Graylog
OK! We’re finally done – it may be necessary to come back and tweak the yaml file, but for the most part, we can get started with Graylog itself! So – let’s run a first test. This is recommended on both Graylog’s tutorial as well as ComputingForGeeks.
On the dashboard, let’s create the first input to get logs by navigating to the systems tab and selecting input:

Now search for Raw/Plaintext TCP and click launch new input:

Once launched, a pop-up window will appear as below. You only need to change the name for the input, port(1514), and select the node, or “Global” for the location for the input. Leave the other details as they are.

##From the command line of the Graylog machine:
On the running Raw/Plaintext Input, there’s a button “Show Received Messages” – click this and scroll to the bottom. If it worked, you’ll see your first message here:

8. Dashboard
Next piece is to get these logs into the dashboard.
On the same page, click the three dots on the top right, and Export to Dashboard

then click Save As and fill out the popup

9. Setting up Connections
Finally – we’re nearing the end. I gotta be honest, this last step is going to be quite different for everyone – I’m using PF Sense, but that will likely not be the case for everyone. I followed this guide:
https://jake.stride.me.uk/posts/2020/06/28/pfsense-suricata-and-snort-syslog-to-graylog.html
The basic idea is to set up Syslog UDP input on the input page, as we did in the previous step. It should be on port 1514, as per the yaml file. Then, I added the extractors per the guide, and then set up a logging server on PF Sense. That’s it! I will continue to update this when I play around with it a bit more.
10. Yaml File
version: ‘3’
services:
# MongoDB: https://hub.docker.com/_/mongo/
mongodb:
image: mongo:4.2
#DB for persistence
volumes:
– mongo_data:/data/db
networks:
– graylog
# Elasticsearch: https://www.elastic.co/guide/en/elasticsearch/reference/7.10/docker.html
elasticsearch:
image: docker.elastic.co/elasticsearch/elasticsearch-oss:7.10.2
#data folder for persistence
volumes:
– es_data:/usr/share/elasticsearch/data
environment:
– http.host=0.0.0.0
– transport.host=localhost
– network.host=0.0.0.0
– “ES_JAVA_OPTS=-Dlog4j2.formatMsgNoLookups=true -Xms512m -Xmx512m”
ulimits:
memlock:
soft: -1
hard: -1
mem_limit: 1g
networks:
– graylog
# Graylog: https://hub.docker.com/r/graylog/graylog/
graylog:
image: graylog/graylog:4.2
#volume for persistence
volumes:
– graylog_data:/usr/share/graylog/data
environment:
# CHANGE ME (must be at least 16 characters)!
– GRAYLOG_PASSWORD_SECRET={{ADD YOUR OWN HERE, this is used for encryption, and isn’t the password}}
– GRAYLOG_ROOT_PASSWORD_SHA2={{ADD YOUR OWN HERE – per the instructions in section 4}}
#user: admin
– GRAYLOG_HTTP_EXTERNAL_URI=http://127.0.0.1:9000/
entrypoint: /usr/bin/tini — wait-for-it elasticsearch:9200 — /docker-entrypoint.sh
networks:
– graylog
restart: unless-stopped
links:
– mongodb:mongo
– elasticsearch
depends_on:
– mongodb
– elasticsearch
ports:
# Graylog web interface and REST API
– 9000:9000
# Syslog TCP
– 1514:1514
# Syslog UDP
– 1514:1514/udp
# GELF TCP
– 12201:12201
# GELF UDP
– 12201:12201/udp
volumes:
mongo_data:
driver: local
es_data:
driver: local
graylog_data:
driver: local
networks:
graylog:
driver: bridge